Updates
Statistics and story: how data is shaping a clearer picture of intimate partner violence
07 Dec 2021
Updates
07 Dec 2021
“Data helps us tell a story of what the problem is and how we are addressing it”
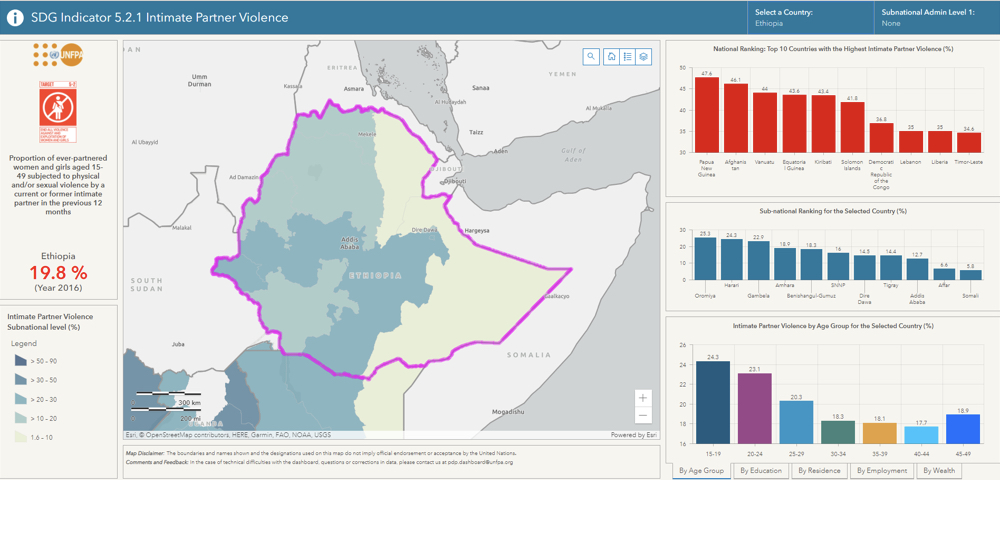
The Geospatial Dashboard on Intimate Partner Violence is an open source platform that helps governments, researchers and service providers use data to better understand the connections between gender-based violence, poverty, education and SDG indicators related to UNFPA’s mandate. The platform uses disaggregated data on a sub-national level and illustrates key socio-demographic characteristics of violence.
“There is real momentum in addressing violence against women globally,” said Ms. Alexandra Robinson, the Gender-based Violence Advisor from the Gender and Human Rights Branch at UNFPA.
The geospatial dashboard project provides access to disaggregated data to the lowest geographical level possible. “Most dashboards provide national-level data which doesn’t give us sub-national variations. This means we don't really know which provinces or states have the highest level of intimate partner violence and where programmes, policies and resources need to be directed.”
Ms. Mar Jubero, Gender-Based Violence Specialist from the Gender and Human Rights Branch, added that the geospatial dashboard contains statistics on intimate partner violence for 119 countries, both from the global north and the global south.
The team that developed the tool used over 200 indicators from prevalence surveys. The SDG (Sustainable Development Goals) indicators are one of the the primary data sources, especially on intimate partner violence: indicator 5.2.1, which measures the proportion of partnered women and girls aged 15 years and older subjected to physical, sexual or psychological violence by a current or former intimate partner in the previous 12 months by any form of violence.
“While we have the data on intimate partner violence at both the national level and sub-national level, we can access and use disaggregated data by age, household wealth, education level, urban or rural and by location to identify those left furthest behind,” said Ms. Mengjia Liang, a Technical Specialist at the SDG Data and Research Population and Development Branch at UNFPA.
Ms. Jubero said a detailed analysis of the data featured in the dashboard by age group, level of education, wealth, employment and regions was undertaken following the release of the dashboard and is reflected in the report “Prevalence, Rates, Trends and Disparities in Intimate Partner Violence:Power of Data in the IPV Geospatial Dashboard”
The dashboard is a showcase of the power of data in supporting more evidence-based programme interventions and responses by other UN partners and international agencies. “This product is a unique offering from UNFPA as a public good to the broader community without duplicating efforts that are already there,” said Ms. Robinson.

The data shows that in more than 75% of the countries, intimate partner violence is highest early on in a relationship, especially among women 15-34 years, compared with 35-49 years. Women and girls in the 15-19 year age group have the highest prevalence across all age groups. The team said this data has implications for programming and for designing gender-based violence prevalence and response interventions.
The UNFPA Technical Division worked on the concept, design and implementation of the dashboard. It was a creative collaboration about the depth of analysis needed. Ms. Robinson said the team is building on the success of a regional project. “The kNOwVAWdata Initiative, which began in the Asia and the Pacific region was the genesis of UNFPA leading work globally around the generation and use of quality data to help inform policies and programmes. It has been a spark behind UNFPA’s effort to make violence against women data accessible and available.”
Ms. Liang said they had to find ways to make the dashboard work for a wider range of users. “We designed the dashboard so that at different levels of capacity, people with different competencies can access and use them.”
Dashboard users extend from UNFPA staff working with stakeholders in designing gender-based violence interventions to frontline service providers, policymakers and academic researchers conducting secondary data analysis using multiple variables. “Researchers are using the data to better understand sub-national variations in a country. They can look at variables like the correlations between employment and economic opportunity and intimate partner violence.”
The dashboard is designed to allow for different types of users to be able to get the information they need.

Ms. Robinson said that dashboard has generated interest in deepening the understanding of what the drivers of intimate partner violence are. “The dashboard is a good start to make disaggregated data available, easy to access and easy to understand. Using the depth of data in the dashboard can help us start to tell a story around what the problem is and how we need to address it.”
To keep expanding the data set, Ms. Liang emphasized how important it is for governments to drive the data collection process. “We want to make sure that each country has ownership of the data and they feel proud of the data. When they see a gap, we hope they are motivated to collect the data to fill those gaps.”
The team pointed out that this is the 1.0 version, and in the coming months, they will demonstrate the ways that data and evidence from the dashboard can inform the investment of UNFPA in solving problems.
“As we become more sophisticated and understand the data, so do our programmes,” said Ms. Robinson. “Over time we will see a shift in what our programmes look like. The dashboard highlights the power of disaggregated data. It helps us know in more granularity who is affected and where, so our programmes and resources can be more targeted.”

Ms. Jubero added that the team is aware that intimate partner violence is significantly under-reported. While the dashboard cannot correct for under-reporting, it does bring together government-supplied data at national and subnational levels, allowing experts to identify which girls and women are most vulnerable.
She emphasized that the positive outcomes of this project have led to its current expansion into a Violence Against Women-Harmful Practices dashboard to include data on lifetime Intimate Partner Violence, non partner sexual violence, femicide, Female Genital Mutilation and Child Mariage. This will allow users to get a picture of different forms of VAW- HPS within a country or sub-national context and the interrelations among them, contributing to improving GBV/HPs programming by being able to design targeted interventions. The Gender and Human Rights Branch is also working on a GBV geospatial programming dashboard that will be linked to the VAW-HPs prevalence dashboard with the aim of bringing together the scope of the problem and how it is being addressed.
As the project expands, they said it has been helpful to re-focus on the connection between data and overall progress. “We are an agency with a responsibility to promote the issues that can help stakeholders achieve the three zeros around the world.” UNFPA is working for a world with zero unmet need for contraception; zero preventable maternal deaths; and zero gender-based violence and harmful practices, such as child marriage and female genital mutilation.
Geospatial dashboard on Intimate Partner Violence